如題,此篇文章記錄我如何使用 gdb 來查看一個卡住的 python 程式
過去工作時還真有遇過某段 python 程式碼卡住,然後看了半天看不出個所以然
當時會 debug 卡這麼久,有一個原因是我真的沒想到會卡在寫 log 的地方,如果馬上懷疑是寫 log 的程式碼卡住,大概 Google 一下就會查到這篇文章了吧:https://stackoverflow.com/questions/24509650/deadlock-with-logging-multiprocess-multithread-python-script
簡述一下卡住的原因: 這段程式碼是跑 multithread ,在 thread 上又做了 spawn process 的動作 假設現在有 t1, t2 兩個 thread,當中 t1 fork 生成 child process,若剛好此時 t2 在運行 logging.Handler.handle() critical section,t1 fork 出來的 child process 會複製到鎖住的 log handler lock 狀態,所以這個 child process 一旦要寫 log 就會卡住,因為 handler lock 的狀態是被占用的,而這狀態永遠不會被釋放,程式就這樣卡住了
當時我記得我是這樣查出問題的,印象這段程式碼是跑在客端接收資料用,要重現問題有點麻煩,加上這問題不是每次都會遇到,是機率性發生,我就乾脆把這段可疑的程式碼抽出來稍微改寫成一個差不多的 python script,方便我直接重跑測試,且也比較方便增加負載提升發生問題機率,一試還真的會卡住,總之就有了重現問題的方式
最後,我就上網查看看如何 debug deadlock,各種嘗試後,終於讓我懷疑是 log 的地方卡住,然後就 Google 查了相關關鍵字,馬上就查到也有人有遇過類似問題,還有 plugin fix 能解決問題
算是一次比較印象深刻的 debug 經驗,debug 過程應該有更好的作法吧,但能解決問題就是可喜可賀~
說了這麼多,這篇文章就是想試試當初我有用到 debug deadlock 的方法,記錄起來以備以後需要
環境安裝
安裝 dbg 和 python dbg
sudo apt install dbg python3-dbg
測試用的程式碼
一個會卡住的 python 程式
main.py:
import threading
import time


lock = threading.Lock()
lock2 = threading.Lock()


def foo():
    with lock:
        time.sleep(1)
        print("foo in lock")
        with lock2:
            print("foo in lock2")


def foo2():
    with lock2:
        time.sleep(1)
        print("foo2 in lock2")
        with lock:
            print("foo2 in lock")

t1 = threading.Thread(target=foo)
t2 = threading.Thread(target=foo2)

t1.start()
t2.start()

t1.join()
t2.join()

print("finish")
使用 gdb
首先跑起上面那個程式
python3 main.py
查看 PID
ps aux | grep python
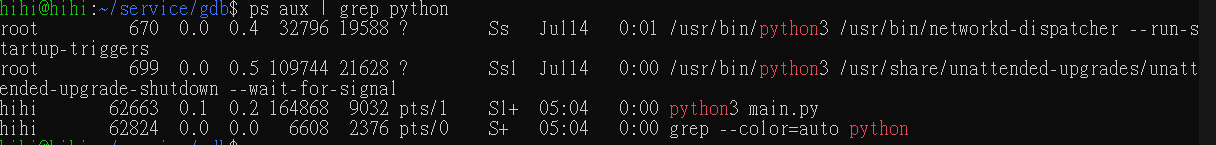
執行 gdb python3 {PID} attach 到該 process
sudo gdb python3 62663

gdb 的幾個常用指令
py-bt:查看當前 traceback 調用棧py-list:查看當前執行位置的原始碼info thread:process 的 thread 資訊thread {thread_id}:thread switchgenerate-core-file:產生 core dump file
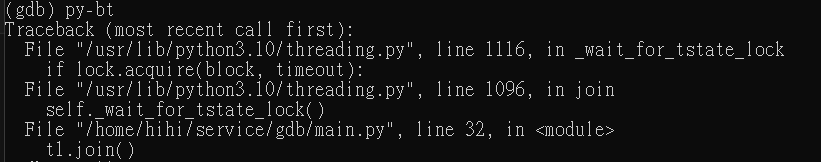
使用 py-bt,可以看到停在 t1.join(),這是主 thread 的情況
使用 info thread 看看這個 process 有哪些 threads

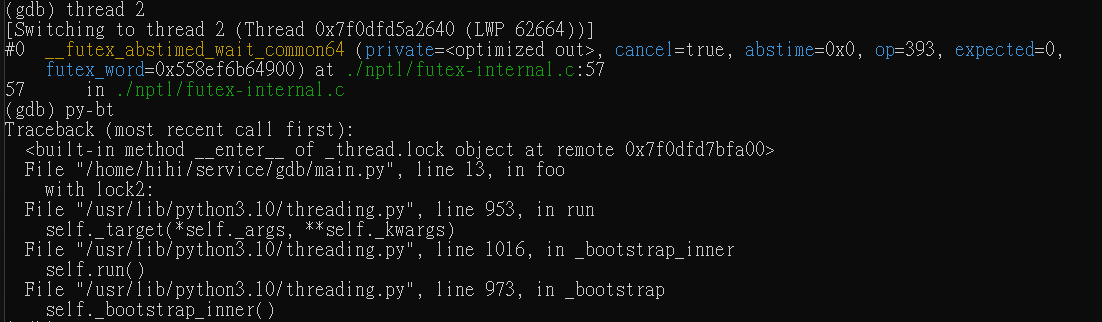
看看 thread 2 的狀況,先使用 thread 2 進行 switch,再使用 py-bt,可以看到卡在 with lock2
使用 generate-core-file,將 process 狀態存起來
之後可以 gdb python3 {core_file_name} 進行 attach,如此即使強制關掉卡住的 process,也可隨時 gdb attach 回卡住的狀態進行分析


gdb 的功能還有很多,但再深入我也不太會操作了,目前我也沒什麼機會用到,如果之後有機會用到,再細學